Historical Traces
One of the most successful ways to read price changes in the financial market is to use Japanese Candlestick charting and techniques. The approach, which is named because its resemblance to a flame, has evolved over millennia in Eastern Asia.
It was originally used in Japan, during the Edo-period (1603-1868), to monitor and forecast price movements of the country’s most prized commodity, rice; which was mostly traded at the Dojima Rice Exchange near the historical commercial capital, Osaka.
Japanese Candlestick techniques, which are based on military tactics of the period, have given traders an advantage long before bar and point and figure charts, while evolving into an appealing strategy for today’s quick and unpredictable markets.


What are the benefits of using Japanese candlesticks?
The following are three compelling reasons to employ Japanese candlesticks:
Dynamic visual effects. Japanese Candlesticks are more clear, visible, and attractive to the eye than other charting tools, providing an x-ray perspective of price movements and emotional health of their chosen market to anyone from a novice to a seasoned veteran. This can be used to assess how the market perceives important fundamental events.
Timing is everything. Japanese Candlesticks are a one-of-a-kind leading indicator that produces improved trading entry and exit timing. Reversal signals may be supplied in just a few sessions, giving it a significant advantage over other procedures that can take weeks. This is why Japanese Candlestick methods are a more appealing tactic in today’s fast-paced and volatile markets.
Techniques of Technical Analysis are improved. Most other Technical Analysis techniques, such as classic trend, pattern, and momentum analysis, as well as the more sophisticated Ichimoku Kinko Hyo or Demark Indicators, complement Japanese Candlesticks. This is due to the fact that candlestick charts and bar charts both employ the same four trading cycle data points: open, high, low, and close.
Price psychology and intrinsic price movement
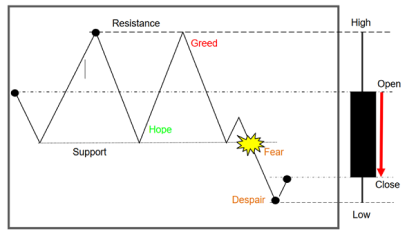
A Bearish or Black Candlestick is an illustration of intrinsic price movements and psychology that is condensed in the line chart above.
During the first session, the price drops, making a low, before finally rising and doubling in value. The number of purchasers in the market decreases at this extreme high point, providing a vacuum for prices to collapse and retrace to the previous low, which has become psychologically ingrained in our minds.
Market players are subject to a cycle of human emotions that is guided by their profit and loss performance (hope, greed and fear).
Assuming we are buyers, we have “hope” for a resurgence higher from support, “greed” for the second profitable run, with instinctive expectations of a new high, and, last but not least, “fear” of potentially “getting it wrong” as price fails at resistance, and “despair” of the unknown as price accelerates downward through support, eventually capitulating into uncharted territory.